A topic that is commonly discussed these days in the personal finance community is something called, “The Lost Decade.” In fact, while I was recently reading several financial magazines, I found out that many would-be experts would have us believe that the past 10 years were completely useless for investors. Quite a bold statement if you ask me!
After reading these statements, I began to wonder, “What facts do the actual numbers dictate to us?” This analysis will be the topic of today’s post.
What Is The Lost Decade?
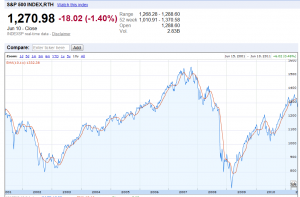
For those of you unfamiliar with the phrase, “The Lost Decade,” it basically is referring to the fact that during the past ten years, the stock market has fluctuated up and down, but has only gone up 0.48% overall from start to finish. This performance can be seen from the Google Finance screenshot of the S&P 500 index above.
Now, I’m definitely not going to argue that a 0.48% return spread over 10 years is good. Quite the opposite, actually. Earning a 0.48% return is ridiculous! If an investor was to just earn this return, it would be quite accurate to call the 10 year period, The Lost Decade. After all, you could have earned more by merely investing in an online bank savings account!
However, my disagreement with this phrase/name stems from my belief that it does not capture the actual way that the majority of individual investors save (or should save) for retirement.
How Do The Majority of People Save For Retirement?
OK, so if I’m not quite ready to jump to labeling the past decade as “The Lost Decade” because it doesn’t capture the way that most investors save money, just how do I believe people go about tackling the beast we know as “investing?”
In my opinion, when it comes to squirreling away the money that matters for retirement, most people invest using dollar cost averaging (or something similar). This strategy involves investing a specific amount of money (or specific % of your income) each month. By doing this, an investor can accumulate shares of the investment he or she specifies at varying price levels, with more shares being purchased during stock market declines and fewer shares being purchased at higher prices.
Because dollar cost averaging results in ownership of shares purchased at many different price levels, further analysis is required before we place a label on the past decade.
Dollar Cost Averaging Analysis of Two Portfolios
After several iterations of trying to decide on the most effective way to demonstrate this, I decided on two hypothetical portfolios – a basic portfolio and an expanded portfolio.
Both portfolios have the following shared characteristics:
- Examine the total return and investment risk (standard deviation) of a $10,000 initial and $500 monthly follow-on investments from June, 2001 to June, 2011.
- Employ an overall asset allocation of 25% fixed income investments and 75% equity investments.
- Assume monthly rebalancing to maintain these asset allocation targets.
- Naturally, passive investing is used because it has been show to outperform individual stock selection on a long-term basis.
- For simplicity, an analysis of the effect of trading commissions, taxes, expense ratios, and inflation is not included.
However, the two portfolios diverge in regards to the specific mix of investments used to achieve the 75%/25% overall asset allocation split.
The basic portfolio invests only in two assets – 1-year Treasury Bills (T-bills) for the fixed income portion of the portfolio and an S&P500 index fund for the equity piece.
The expanded portfolio uses the exact same index mutual fund asset class selection as I do currently, as shown in the list below. All investments are assumed to be Vanguard index mutual funds, except for the T-bills portion.
Note: All Vanguard mutual fund historical price data was downloaded from Yahoo Finance for the analysis.
This asset class mix/investing strategy was the result of multiple books about Modern Portfolio Theory, including A Random Walk Down Wall Street by Burt Malkiel, Stocks for the Long Run by Jeremy Siegel, and What Wall Street Doesn’t Want You to Know by Larry Swedroe.
1. % Cash (T-bills Target 5%)
2. % Non-Inflation Protected Bond Funds (Target 15%)
3. % TIPS Bonds – (Target 5%)
4. % International Equity (Target 11%)
5. % International Emerging Markets (Target 11%)
6. % Domestic Large Cap (Target 8%)
7. % Domestic Small Cap (Target 8%)
8. % Domestic Small Cap Value (Target 14%)
9. % Domestic Large Cap Value (Target 13%)
10.% REIT (Real Estate Investment Trust – Target 10%)
As you can see in the list above, instead of just having one equity or fixed income asset class (like T-bills or the S&P 500), there are MANY! In addition, we have also added both international and emerging market index funds in to the mix.
I hypothesized that since these different asset have a correlation that does not equal 1, the expanded portfolio would offer a higher return for a given level of risk, consistent with the Efficient Frontier hypothesis/phenomena.
Results
“So, enough talk, Jacob, what did you find out as your results?!”
The complete results of my analysis can be reviewed and downloaded at the shared Google Docs spreadsheet below. Enjoy!
However, a summary of my findings can be found in the table below.
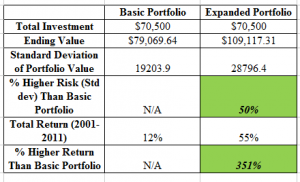
The results of the basic portfolio with the application of dollar cost averaging were somewhat disappointing, with a total return over the past ten years of only 12%. However, this is still definitely better than a 0.48% overall return! During the ten years, we saw that by using this investing strategy, your money would have grown to a current value of ~$79,000.
The results of the expanded portfolio were surprisingly much better. I guess I always have read that this asset allocation stuff works, but have never done this in-depth of an analysis to determine just HOW effective it is!
A total return of 55% was realized over the 10 years. While this is not the 10% yearly average return that the stock market has provided since the 1800’s, it is a 351% increase in return compared to the basic portfolio. Quite amazing! The ending value of the portfolio was almost $30,000 higher than the basic strategy.
It is important to realize that the expanded portfolio value standard deviation did increase by 50%, so it was not completely a free lunch. The increased standard deviation was most likely contributed by the small cap, small cap value, and emerging market funds, as these are generally regarded as higher risk investments.
Conclusions
Now that the dust has settled (or maybe a more accurate saying would be that the spreadsheet electrons have settled) from this analysis, let’s take a step back and see what sort of conclusions we can draw. Several of the key ones I could think of are listed below:
- Even though the past ten years were not the best for investors, I don’t think I would consider them to be “lost” and completely useless to our wealth building goals. However, I suppose this depends on your required rate of return.
- The application of periodic investments using dollar cost averaging can produce higher overall returns than just investing one lump sum because it enables you to purchase lower-priced shares.
- Passive investing works. I would recommend using it! :)
- The addition of different asset classes (small-cap, large cap, value, international, etc) to a portfolio is beneficial for returns and risk management. However, it isn’t absolutely necessary, unless you are someone who enjoys managing your own money (as I do). If you like to keep things simple, merely having 2 index mutual funds will most likely provide adequate exposure.
RECOMMENDATION FOR BUILDING WEALTH
Manage Your Finances In One Place: The best way to become financially independent and protect yourself is to get a handle on your finances by signing up with Personal Capital. They are a free online platform which aggregates all your financial accounts in one place so you can see where you can optimize. Before Personal Capital, I had to log into eight different systems to track 25+ difference accounts (brokerage, multiple banks, 401K, etc) to manage my finances. Now, I can just log into Personal Capital to see how my stock accounts are doing and how my net worth is progressing. I can also see how much I’m spending every month.
The best tool is their Portfolio Fee Analyzer which runs your investment portfolio through its software to see what you are paying. I found out I was paying $1,700 a year in portfolio fees I had no idea I was paying! There is no better financial tool online that has helped me more to achieve financial freedom.
For reference, see my post highlighting whether it is safe to invest with robo advisors like Personal Capital, Wealthfront, and Betterment.


I can say that I started out in 2001 with a negative net worth. Now, that net worth is positive and works out to the equivalent of saving about 10% of my income annually over the course of the decade. I would like to do a better job over the next 10 years.
Congrats Joe! I look forward to following your progress!
That’s the problem with putting all of your money into the market. There is no guarantee that your investment will increase in value. In fact, it COULD decrease. If there are debts to pay off, it would be wiser to pay those first rather than invest in a market that only earns 0.48% in 10 years.
Absolutely true! You’ve got to be debt free before you start trying to invest/save for retirement!
Thanks for the comment Derek. I was actually reading one of David Bach’s books (Start Late, Finish Rich) recently on this topic of paying off your debts first vs. investing for retirement. His take was that a person should split their savings (beyond the minimum debt payments) and invest half of that savings to retirement and the other half towards paying off the debt. I haven’t decided where I stand on this issue yet…
Fantastic analysis Jacob! Question on rebalancing – you mention monthly, I’m assuming you don’t sell any holdings but adjust future contributions accordingly?
Also does this take into account dividends? (I’m assuming it does, but just to clarify!)
I have a 5% threshold before rebalancing. If the asset is in a taxable account I avoid selling (to avoid capgains), tax-deferred sometimes I do depending upon cash at hand.
Great questions Moneycone! I evaluate my asset allocation levels monthly and either adjust my future contributions accordingly or sell my current assets (only if they are in a tax deferred account) and buy new funds to maintain my asset allocation targets within the +/- 5% band.
This does include dividends (assumes all dividends are reinvested).
Great post Jacob. I’m a big believer in the Modern Portfolio Theory and dollar cost averaging. It’s refreshing to see a post that isn’t gloom and doom about investing over the last ten years.
Thanks for reading Matt. I’m not going to lie – investing over the past 10 years wasn’t the best. However, I still think it wasn’t as bad as some of the financial media make it out to be!
I’m much more interested in putting my money back into my business. I don’t know enough about the stock market (or any of the other vehicles you mentioned) to feel comfortable putting my money there. Everyone says it’s great, but what if you were planning to retire in 2009?
I’m a big believer in staying within one’s comfort zone with investing, so that’s probably a good thing to avoid the market. However, there are “safer” options of investing as well, which people should shift towards as they get closer to retirement. For example, if someone was 62 in 2006 and planning to retirement at age 65 in 2009, they would not have any business investing 80% of their money in equities anyway. In their case, it would have been best to choose bond funds or money market securities.
interesting and revealing analysis. what is the actual annual average inflation over the past decade? i don’t think .48% would beat it, nor would the basic, but the results from the expanded p-folio might (net of tax effect)? but then again many say we have undergone a deflationary period – thereby the basic p-folio may still put us ahead in terms of spending power? interesting stuff….
Good question Sunil! The average inflation rate (per year) over the past 10 years has been 2.28%. So, the total return of the basic portfolio would be under the total inflation %, but the expanded would still be over.
Excellent article. The “lost decade” thing strikes me as just another vehicle for the financial press to generate interest. As with your expanded portfolio, well diversified investors who hung in there have done decently well over the past ten years. As I sometimes say to clients, turn off CNBC and let’s take a common sense approach to your portfolio.
I’m with ya’ Roger. I sometimes feel like the news is sooo depressing to watch! haha
Great write up! I’ve been investing for just about 10 years and I don’t consider it a lost decade by any means. Dollar-cost averaging has worked for me.
Good to hear FSYA! You ever tried Dollar Value Averaging? I did a recent study that showed promising results for it giving better returns than cost averaging…
Even if there had not been a drastic increase in index value. We are knowledgable on bubbles and their subsequent burst. We had dot com burst then we had housing burst. The last decade taught us to be informed and cautious investors. On anyd ecade money can be made by timing the market correctly. Even in this bad decade Mr. Buffet made a lot of money, in fact he made more absolute money compared to previous decades.
Nice post, great food for thought.
I wasn’t investing during the last dot.com bubble/burst period, so it will be interesting to be “involved” in how the next bubble plays out. Hopefully, we as investors have learned our lesson!
Great article, Jacob! I wasn’t an investor for the lost decade. I started my retirement savings in 2008…talk about timing :) I can’t complain about my returns at all. Most of what I bout was at the bottom. The fluctuations I’ve seen have been after the big run up of the last two years.
2008 was when I started working (after college), so that’s when post of my money started being invested as well.
Really good work Jacob, I like these types of analyses. Yours yielded some interesting takeaways. I would have to say that this was a decade with a lot of volatility in different investment sectors (stocks, real estate, etc), so the ‘lost decade’ label might apply to people on a case by case basis. But overall, I agree with your broad assessment that this past decade wasn’t lost – for everyone as a whole, anyway.
Love your analysis! It just goes to show how holding a diversified basket can provide great returns over time!
That’s fascinating analysis. I try to keep my 401k diversified between fixed income, Large Cap US, and emerging markets. I used to hold a REIT but it did horribly. At least I got to write off the losses when I finally gave up and sold it.
Thanks for sharing what you invest in. You might also want to consider investing in some of the more “mature/established” foreign markets (Europe, Australia, etc) in addition to emerging markets. That might provide some more stability to your overall portfolio as well as international diversification.
Nice analysis Jacob! Also, the 0.48% returns or whatever it is for the past decade doesn’t account for dividends, does it? It can’t, b/c the S&P500 dividends alone have been averaging about 3% every year since then, which would mean a nice return compounded after 10 years.
The one thing to note is the Standard Deviation in your table. A $19,000 SD swing in only a $79,000 portfolio could also mean $60,000 left with an initial investment of $70,000 for a 15% loss!
Dollar cost averaging is the bomb. Even if you suffered extremely low returns over the course of the decade, that effectively means you bought cheap and will be able to reap the rewards of those discounted purchases for years/decades to come.
If you had put your money in a checking or savings acount, you would be waiting to buy at a higher price and not garnered that much in yield anyway. It’s like holding on to your cash to buy something as soon as it goes off sale.
Net worth and gains on paper are good, but it can be lost just as quickly. Having the cheap assets in place for future growth is where you make your money.
Excellent article, Jacob! Great analysis of the basic portfolio and expanded portfolio, too.
My net worth is a lot better than 10 years ago. We keep investing and the dollar cost average really work wonder over time. I think it isn’t a lost decade at all unless you stop contribution into your investment over that period.
Jacob, Superb! Great, clear cut analysis. Even your more complex portfolio is not difficult to manage if you automate your contributions. And of course there are “moderate portfolios” with fewer holding than the expanded, but more than the basic. Great job!!!
Good point Barb! I sort of “go crazy” with the different types of index mutual funds I invest in. That’s just because I enjoy this sort of stuff of course! There are definitely easier ways to do it as well with a lesser number of funds.
Thanks for doing such an in depth analysis. I think everyone here has found it helpful.
I think you have just displayed why it is so dangerous to apply general terms and concepts to the market at large. You can always look at a particular industry, exchange, investment vehicle, and find great losses, but it’s dangerous to paint all investing with that same brush.
Great job!
Great analysis. This whole ‘Lost Decade’ thing never made too much sense to me; it’s (a) based on a single (albeit important) index, (b) assumes a single block investment that is never added to or shifted, which is hardly the way most people invest, and (c) as Financial Samurai mentioned, doesn’t include dividends and only focuses on the index price. Not exactly a realistic view to consider the investment landscape. Anyway, great post, and excellent information.
We just have to ask ourselves, are we wealthier now than 10 years ago.. and for those who have been working for all that time, the answer is absolutely most of the time!
Thanks for reading Roger!
I agree with your post and with Roger’s comments, above … the “Lost Decade” concept doesn’t make sense because it’s not realistic. People reinvest dividends, people continue to invest throughout the decade (not just in 2001), and people rebalance their portfolios and allocate their assets. All of those actions make enormous differences in portfolio performance.
I’m still gonna say that it was lost. I’m sorry but I didn’t realize any gains. Then again, I was in my 20’s so I invested most aggressively and lost aggressively as well, but that’s what you’re supposed to do in your 20’s right? Risk big because time is on your side. Well, I’ve gained more in the past 2 years than the 10 years before combined.
Thanks for sharing Sandy! In general, how did you invest during the past ten years? Did you invest in regular periodic intervals?
It was a lost decade in some ways, but if you had money to invest in end of 2008 and 2009 it wasn’t so bad (though the fat lady hasn’t sung yet!). In terms of personal development it was not a lost decade at all; it was my best yet. ;)
I agree Invest it Wisely. I imagine that those who actually had money to invest as the market was tanking during those years did turn out all right. I was fortunate enough to have just started my first job out of college, so was actively investing during the lowest market points.
Try adding gold to that portfolio and you will do far better than 12%.
Better yet, check out the Permanent Portfolio strategy to investing. It had great returns throughout the “lost decade.” I’m in the process of re-allocating to that fixed portfolio now.
Thanks for reading Brave New Life! I’ll have to check out the Permanent Portfolio strategy. I’ve never heard of that. What’s the crux of that strategy? Do you have any good resources you’d recommend I investigate for more information?
Wow, its AMAZING to see what a difference asset allocation makes! Like you, I always hear about it but never realized it made SUCH a big impact!